
Introduction
Time series are used for two numerical variables, one of which is time. Since time is continuous, they are shown as line charts (the data points are joined up).
Example
New Zealand tobacco consumption in cigarette equivalents per person aged 15 years and over, 1991-2009.
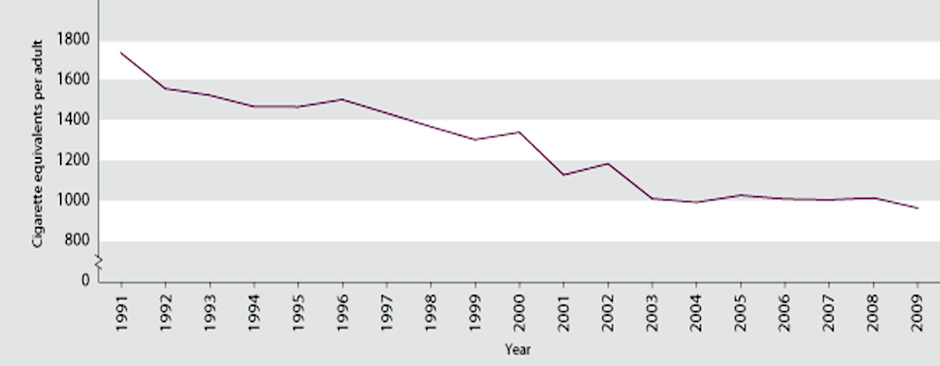
Source: Statistics New Zealand
Video
This video requires a browser capable of HTML5 or Flash video.
Documents
There are two files associated with this lesson:
- Instructions for this lesson (pdf)
- Data file (xls)