Introduction
Histograms are used for (relative) frequencies in ranges of continuous numeric variables. For example, numbers of people in different income ranges.
Key properties
- There are no gaps between the bars to indicate that the data is continuous
- The area of the bar represents the frequency
Example
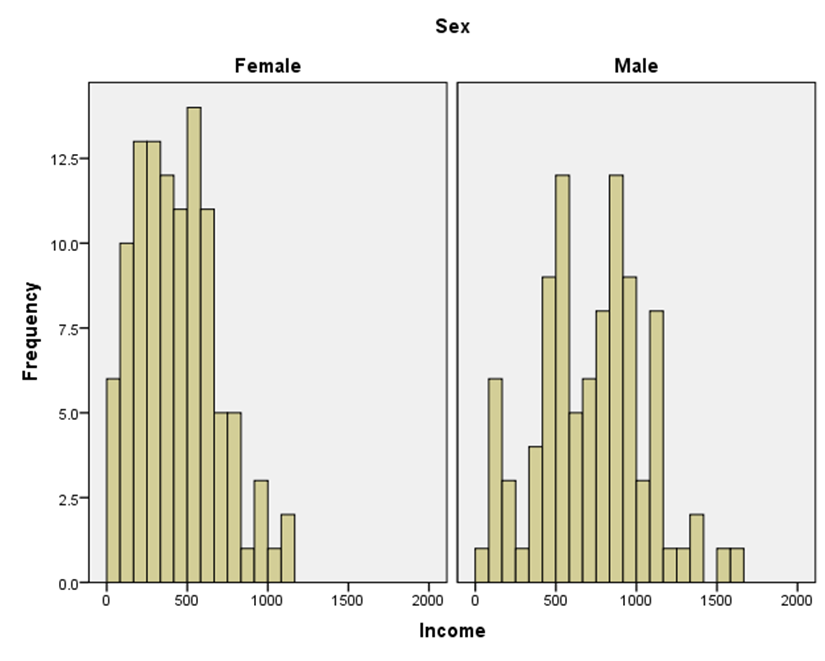
Income of a small sample of New Zealanders (first 10 of 200 records).
(Source: SURF for Schools: Income survey, Statistics New Zealand)
| Sex | Age | Hours (weekly) | Income ($ per week) |
|---|---|---|---|
| F | 15 | 4 | 87 |
| F | 40 | 42 | 596 |
| M | 38 | 40 | 497 |
| F | 34 | 8 | 299 |
| F | 45 | 16 | 301 |
| M | 45 | 50 | 1614 |
| F | 36 | 12 | 201 |
| M | 35 | 45 | 934 |
| F | 38 | 26 | 624 |
| M | 37 | 50 | 533 |
Histograms of the above data look like this:
Video
This video requires a browser capable of HTML5 or Flash video.
Documents
There are two files associated with this lesson:
- Instructions for this lesson (pdf)
- Data file (xls)